ANNUAL
MEANS / TOTALS (1985 - 2008 inclusive)
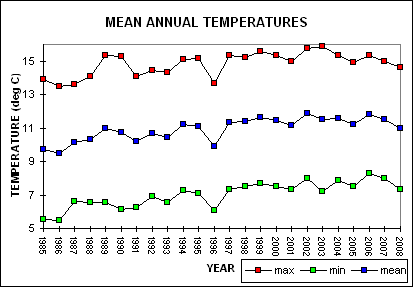
 The graph to the right shows the mean annual maximum, minimum and overall
average temperatures for the period 1985 - 2008 inclusive. Although climatologies are typically calculated using 30 years of continuous observations at a single site with unchanging exposure and surroundings, the Sittingbourne site now has a database of 24 years and thus can provide a reasonable summary of mean conditions at the site. Mean annual average maximum, minimum and mean temperatures for the site are 14.8ºC, 7.0ºC and 10.9ºC respectively.
1989, 1997, 1999, 2000, 2002, 2003, 2004 & 2006 show up as particularly warm years with both average annual maximum temperatures above 15.3ºC and overall mean temperatures above 10.9ºC.
1985, 1986 and 1996 proved to be the coldest years with overall mean temperatures below 10ºC.
It is worth comparing the mean maximum temperature ranges from the highest, 15.89ºC in 2003, to the coldest, 13.47ºC in 1986. There really is quite a difference!
2007 proved to be the sixth warmest year overall in the series with an overall mean temperature of 11.49ºC, the record being 11.88ºC set in 2002. In terms of maximum temperature it was the thirteenth warmest with an average of 15.01ºC, but only the coolest since 2005 when 14.9ºC was the overall mean. 2007 was notable, however, for having the 3rd highest overall minimum temperature of 7.96ºC narrowly missing the 8.00ºC set in 2002 and highest value set the year before in 2006 (8.27ºC). In terms of daily values, the hottest day was the 5th August with 28.3ºC (lowest since 1991) , and coldest night the 20th December with -5.6ºC.
2008 turned out to be somewhat cooler than 2007 with an overall mean temperature of 11.00ºC, the 14th warmest or 11th coolest year. This was the coolest year since 1996 when the mean temperature was just 9.88ºC. The mean maximum temperature for 2008 was 14.65ºC (16th warmest / 9th coolest), again the coolest since 1996 when the mean maximum was just 13.69ºC. The overall mean mean minimum temperature for 2008 was 7.34ºC (10th warmest / 15th coolest), the coolest since 2003 when the mean minimum was 7.2ºC.
There
does seem to be a gradual warming trend over the whole measurement period though
it is interesting to note that the 1996 values are noticeably lower than preceding and subsequent years. Also it is interesting to note that temperatures have dropped in the two most recent years in the record.
 Rainfall
is another interesting variable that can show large year to year variations.
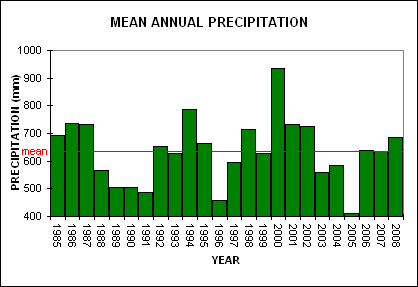
The mean annual precipitation for Sittingbourne for the 24 year period 1985-2008 is 635.9mm. Low-lying areas of Southeast England and East Anglia are the driest parts of the country.
2005 holds the record for the driest year with just 410.3mm measured, less than 64% of the average. June of that year saw just 4.2mm collected in the standard 5 inch rain gauge. The highest 24 hour precipitation total was just 18mm on 2nd March. One would usually expect a few days with in excess of 1 inch of rain (25.4mm) falling, perhaps in summer thunderstorms, but in the 6 days when thunder was heard (1985-2008 annual average 8.8 days) relatively meagre amounts of precipitation fell. The local reservoir Bewl Water at the end of 2005 recorded its lowest level ever at just 35% full.
2006 proved to be a near-average year for precipitation with 640.0mm measured. July was the driest month with just 5.6mm collected, and incidentally was also the hottest with an average maximum temperature of 26.56ºC the warmest month in the series (previous record August 1990 with 26.00ºC). The wettest months were May, August and October with 100.8, 99.7 and 99.8mm respectively. Again 2007 was very near average with 634mm recorded in the standard 5 inch copper Snowdon rain gauge. April was the driest month with just 0.8mm recorded but this was followed by a rather wet May (88.4mm) and even wetter July (96.6mm), the two wettest months of the year.
2008 proved to be the wettest year since 2002 with 687.1mm of rain recorded (2002 saw 725.7mm fall). February and June 2008 were notably dry with just 16.6 and 15.1mm of rain recorded respectively. November was the wettest month with 124.3mm recorded (>= 0.2mm of rain fell on 20 days). May was also a very wet month with 112.7mm recorded although only 11 days were wet (days with >= 0.2mm of rain falling).
Looking back in time 1985-87 were years with above average precipitation followed by 4 years where the annual means were below average. May 1989 is worth mentioning as it was the driest month on record with just 0.4mm being recorded. 1992-93 were years of near average precipitation followed by a very wet 1994 with 785mm, the second wettest year since 1985. Following a near average 1995 for precipitation 1996 proved to be the second driest year since my records began with just 459mm falling into the Snowdon gauge. 1997 saw a rise in the rainfall total to just under 600mm, still below average but certainly a lot wetter than the exceptionally low 1996 figure. The 1998 rainfall total was some 12% above the 1985-2008 mean with an exceptionally wet April and early Autumn and 179 wet days overall. Even so, just 4.8mm fell during the whole of August! The year 1999 ended with floods in many parts of the UK but overall in Sittingbourne the annual total was very close to the overall mean.
The
year 2000 was an exceptionally wet year with 935mm of precipitation recorded,
some 47% above the 1985-2008 mean! June proved to be the driest month
of 2000 with just 12.6mm measured whilst October was the wettest with
216.7mm (wettest month since my records began). Overall a very wet autumn
with 408.2mm recorded, nearly 44% of the annual total! 2001 and 2002 proved to
be more wetter than average years with 733.4mm and 725.8mm of precipitation being
recorded, 15% and 14% above the 1985-2008 mean respectively (the fourth and fifth wettest year since
records began). 2003 and 2004 proved to be drier than average years with 560 and 584mm of precipitation respectively.
Last updated Saturday 8 February, 2025 10:33 AM.